
About 250 kilometres above Earth, a spacecraft weighing roughly a tonne was being nudged off course by the last traces of the atmosphere. To counter that drag, its engine could deliver up to 20 millinewtons of thrust. On Earth, that is about the force it takes to hold two grams against gravity. For the European Space Agency’s GOCE satellite, getting that tiny push right was part of making a map. ESA mission specifications · The first in-orbit drag measurements.
One instrument did two jobs
Gravity varies slightly from place to place. A satellite flying low can resolve finer features of the field, but it also encounters denser air. Consider what happens as it flies through a patch of that air. Drag slows the spacecraft along its orbit. An instrument sensitive enough to detect small variations in Earth’s gravity also picks up this disturbance. How could the team tell the two effects apart?
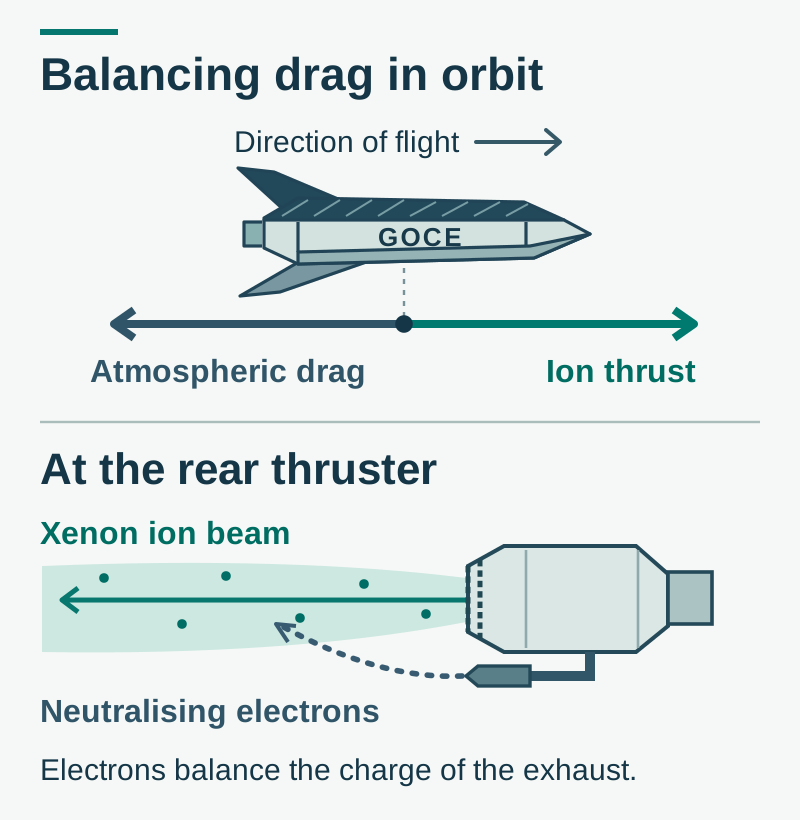
Inside GOCE were six accelerometers, arranged in pairs half a metre apart. Take the two at opposite ends of one arm. The difference between their readings tells scientists how gravity changes over that short distance. The average picks up acceleration common to the pair. The flight controller used the shared acceleration in the direction of travel to adjust thrust. As the drag grew, the ion engine pushed a little harder. The instrument that needed a quiet ride helped provide it. The GOCE engineers explain the instrument · How the controller used its readings.
Follow one xenon atom
GOCE carried 40 kg of xenon. A small flow from the tank entered the thruster’s discharge chamber. There, an electron could strike a xenon atom hard enough to knock out one of its electrons. The atom now carried a positive charge. A voltage applied across a set of grids accelerated the ion out of the back of the spacecraft. Each departing ion carried momentum one way and gave the satellite momentum the other way.
Beside the outlet, a separate device released electrons into the exhaust. This balanced the charge in the outgoing beam and kept the spacecraft from accumulating a negative charge as positive ions escaped. The solar arrays supplied electrical energy to the thruster. The xenon supplied the matter it could throw overboard. ESA’s illustrated guide to GOCE’s ion thruster, page 21.
Why choose xenon? A heavy atom carries more momentum than a lighter one travelling at the same speed. Xenon is also chemically inert under ordinary storage conditions and can be packed densely in a pressure vessel. And it is comparatively easy to ionise. Removing the first electron takes about 12.13 electronvolts for xenon, against 14.00 for krypton. That figure describes one step inside the thruster. Engineers still have to account for the power used to sustain the discharge and accelerate the beam. NIST xenon data · NIST krypton data · NASA on choosing xenon.
What a second spacecraft did with the same gas
On ESA’s SMART-1, xenon had a different job. A Hall-effect thruster gradually changed the spacecraft’s orbit until it reached the Moon. A magnetic field constrained the motion of electrons in a channel, and an electric field accelerated xenon ions out of it. GOCE’s gridded thruster and SMART-1’s Hall thruster both expelled charged xenon, but the hardware used to accelerate the ions differed.
SMART-1 launched with 82.5 kg of xenon in a 49-litre tank and used 74 kg to reach its lunar observation orbit. Each hour of thrust helped SMART-1 change its orbit. GOCE spent its xenon cancelling an unwanted change so its instrument could take a cleaner reading. ESA’s SMART-1 propulsion and flight figures.
The last push, and the map that followed
On 21 October 2013 at 03:16 UTC, GOCE’s onboard system switched off the ion engine. The pressure in its xenon feed system had fallen to about 1.5 bar. The engine had run below its normal pressure range for several days. After four years of drag-compensated flight, the usable supply had finally run out. The flight operations manager’s log that morning.
A year later, researchers used the gravity data to answer a question about the oceans. GOCE supplied a reference surface called the geoid, the shape a still ocean would take under Earth’s gravity and rotation. Researchers subtracted that surface from average sea heights measured by other satellites over 20 years. The remaining slopes let them estimate surface currents, which they checked against measurements from buoys. One result of those almost imperceptible pushes in orbit was a better map of moving water on Earth. ESA’s account of the ocean-current map.
What belongs on a xenon enquiry?
For a propulsion laboratory, “high-purity xenon” leaves an important question open. How much of each impurity can the hardware tolerate? One NASA hollow-cathode procedure called for xenon above 99.999% purity and set separate limits below 0.1 ppm each for oxygen and water. Those figures belong to that particular procedure. For a quotation, give the limits from your own test or flight specification, the quantity in kilograms, the delivery pressure and connection, and the batch analysis you need. NASA hollow-cathode procedure, section 4.4 · SG Trading xenon grades and impurity limits.