
Imagine laying two plots of the same spool of fibre on top of each other. One was recorded at the factory, the other after a laboratory hydrogen-ageing test. Each shows how much light is lost per kilometre at each wavelength. At 1383 nanometres, a bump has grown on the second trace. The fibre is still intact. What changed inside the glass?
A water peak in dry glass
The bump gets its name, the water peak, from hydroxyl groups in the silica. A hydroxyl group is an oxygen atom bonded to hydrogen. Light at certain wavelengths can give up energy to the vibration of that bond. Measuring the loss near 1383 nm is particularly revealing because one of the O–H absorption bands falls there, between the familiar telecom wavelengths of 1310 and 1550 nm.
Some hydroxyl groups can already be present when a fibre is drawn. In processes that build a preform from porous silica soot, manufacturers dry the soot before consolidating it into glass. Others can form later. Hydrogen molecules in or around a cable can diffuse into the glass, where some react with defects. When that reaction creates new Si–OH groups, more light is lost at the water peak. Drying the preform and protecting the finished fibre address two different moments in its life. Qian, Liu and Tu’s study of low-water-peak fibre.
What a neutron does to a chemical bond
Ordinary hydrogen, or protium, has one proton in its nucleus. Deuterium has one proton and one neutron. Both atoms can form a bond with oxygen. Picture two weights on similar springs. Give the heavier weight a push and its vibration takes longer to complete. The same mass effect makes the O–D bond vibrate at a lower frequency than O–H. The light that excites the corresponding vibration has a longer wavelength.
Researchers saw the shift directly in pieces of fused silica used as optical windows. After deuterium treatment, the absorption near 1380 nm diminished and a peak appeared near 1850 nm. These are the first overtones of the stretching vibrations, at roughly twice their fundamental frequencies. The glass still absorbed light, but the O–D peak lay well beyond the wavelengths of interest in that part of a telecom link. Kumar and Fernelius, spectroscopy of fused silica.
Where the glass absorbs light
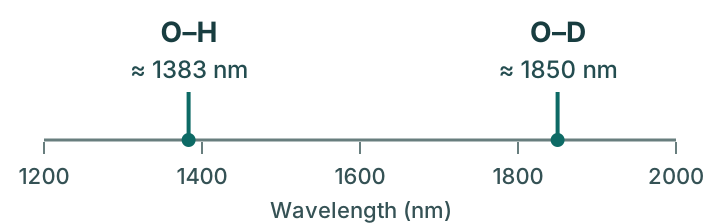
What happens to a spool in the treatment chamber?
An early Bell Labs experiment started with fibre that already had an appreciable water peak. Heating a single-mode sample in deuterium allowed hydrogen in existing hydroxyl groups to exchange with deuterium. Its loss peak at 1.38 micrometres fell by more than a factor of ten. That experiment asked whether an existing peak could be reduced. A manufacturer drawing low-water-peak fibre today also has a second concern. How much could the peak grow later? The Bell Labs fibre experiment.
One production route exposes drawn fibre to deuterium gas (D₂) so it can react with available sites before ordinary hydrogen reaches them. To judge this treatment, Qian and colleagues measured the initial attenuation, repeated the measurement after D₂ treatment and took a third reading after a hydrogen test. Subtracting the first reading from the second gave the optical cost of the treatment itself. The rise from the second to the third showed how much susceptibility to hydrogen remained.
In their chamber, filled with nitrogen and deuterium, 40 hours at 1.0% D₂ left the fibre vulnerable enough to fail the team’s hydrogen-ageing test. Raising the concentration above 1.5% introduced measurable loss at 1383 nm during the treatment itself. Changing the glass design also changed the outcome. A buffer layer between core and cladding reduced the excess loss to below 0.005 dB/km even at 2.0% D₂ for 40 hours. It would be easy to copy a gas concentration to another line and miss the effect of the glass being drawn. Treatment trials, figures 2–4.
Reading a figure in dB per kilometre
Suppose a sample measures 0.30 dB/km before ageing and 0.35 dB/km afterwards at 1383 nm. The increase is 0.05 dB/km. Over 60 km of identical fibre, that small change adds 3 dB of loss. With the same launched power and everything else held constant, the receiver gets about half as much light at that wavelength as it did before ageing.
For G.652.D cable, the August 2024 edition of ITU-T G.652 gives a maximum of 0.40 dB/km at 1383 ± 3 nm after hydrogen ageing. In the example, the number to compare with that limit is 0.35. The recommendation calls for type testing on sampled fibres and excludes short cables such as jumpers from these attenuation limits. For a commercial example, Furukawa describes why it offers low-water-peak fibre for metro and access networks. ITU-T G.652, Table 2 and notes · AllWave ZWP fibre.
For a gas enquiry, two percentages deserve separate lines. The isotopic assay tells the plant what fraction of the hydrogen atoms are deuterium. The D₂ concentration in a premix tells it what fraction of the whole gas mixture is D₂. Specify the balance gas, impurity limits and the reporting basis for each figure. For the earlier stages on the same line, see how helium helps consolidate the preform and cool the drawn fibre.